
The term ‘sweat your assets’ is familiar to many and is credited to Ray Kroc in the 1970s, regarding his work with the McDonald’s franchise in the USA. Clearly there are many aspects to the success of McDonald’s, and this quote is interesting to reflect on because there can be consequences if that is the only way we consider our assets.
According to ISO 55000 for Asset Management, there are six types of assets listed below.
- Digital (DAM) – processing and storage.
- Fixed – property, plant, and equipment.
- IT (ITAM) – hardware and software.
- Enterprise – holistic view across all assets.
- Financial – investments.
- Infrastructure – utilities, transport.
Conspicuous by its absence are People, who according to Sir Richard Branson are “the most important asset”. This article is deliberately entitled ‘Optimising asset performance’ for reasons I hope will become clear.
Maximising customer value
The common goal of all organisations is to meet the customers’ requirements completely, repeatedly, and in most cases, profitably. If we focus our attention on fixed assets, which account for the majority of value-added work, then we can uncover some interesting points to consider.
Firstly, if we overproduce by constantly working the equipment beyond customer demand, then we are (in Lean terms) creating waste. This is the worst form of waste because we create inventory, which is not needed and overconsume raw materials, which can send spurious signals throughout the supply chain, leading to even more waste.
Secondly, are the assets operating at optimal condition or do we experience breakdowns, run below expected rate, or produce defects? These factors can dramatically reduce the margins or even run at a loss, meaning the more we make, the more we lose.
The model to help us here is the measurement of Overall Equipment Effectiveness (OEE). In contrast to utilisation, OEE looks at how well the asset performs when we use it.

SIMON CARR
Business Development Coach
Breaking down the numbers
We can calculate utilisation as the proportion of time the equipment runs. We may constrain this to the shifts we operate, however in complete terms we can look at how utilisation compares to 24/7 –the absolute total available time. The formula below can be used for calculating utilisation.

Clearly, the greater the numerator, the greater the utilisation, but what if the output is poor? The OEE measure is far more useful to really understand what is going on, and it has three mutually exclusive elements that, when brought together, provide an overall measure of how effective our assets perform. The formula for OEE is as follows:

For example, if we have an eight-hour shift with 30 minutes for lunch and two 15-minute comfort breaks, our denominator is seven hours (whereas in utilisation it would be eight). If we lose 30 minutes for breakdowns and 30 minutes for product changes, we only actually ran for six hours, so our Availability calculation is 6/7 x 100% = 85.7%.

Continuing with the example, we only actually ran for six hours. If we have a run rate of 100 parts per hour, we expect 600 good parts, however there can often be fewer. In our example, we only have 500 parts, so the Performance calculation would be 500/(6×100) x 100% = 83%.
The final calculation is Right First Time.

We would hope all 500 parts meet the quality standard; however, this is often not the case. In our example, we have 50 rejects, of which 25 are scrap and 25 rework, so 450 Right First Time. In our example, the quality calculation is 450/500 x 100% = 90%. Finally, OEE:

In our example, we multiply as decimal fractions 0.875 x 0.83 x 0.9 x 100% = 65%.
This would compare to a utilisation of ‘using’ equipment for six and a half hours of an eight-hour shift, so utilisation = 6.5/8 = 81%.
People may say “so what?”; this equipment might appear well utilised, but it is only making good product a little over half the time! What’s more, that figure is only going to get worse unless we operate it correctly, perform regular maintenance and solve problems as they occur; ideally whilst they are small problems.
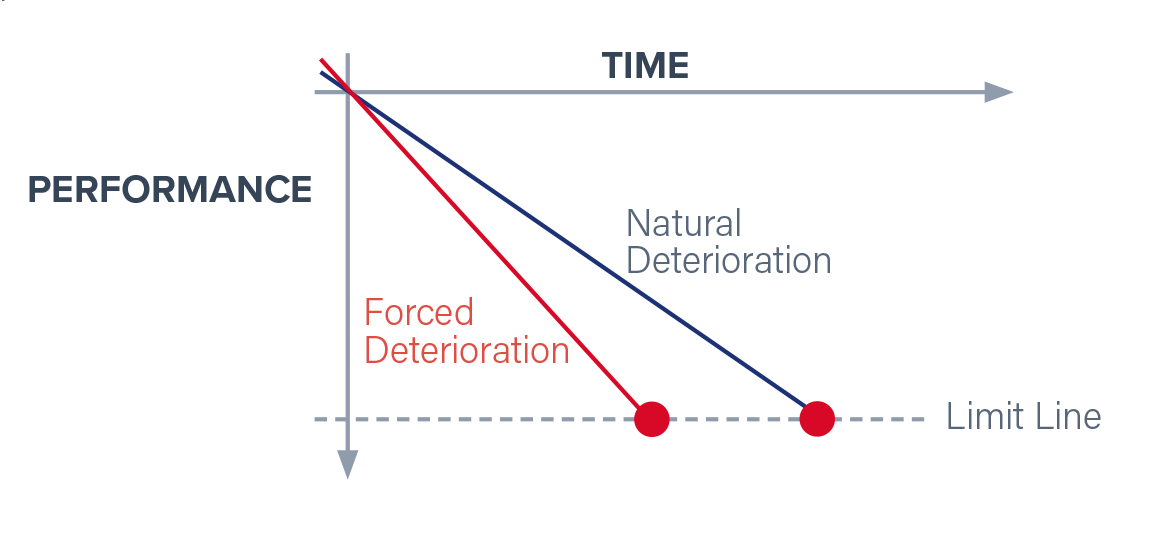
This chart shows what happens over time to any asset as it is used. Components wear until they need to be replaced (ideally planned before breakdown occurs). The two lines represent what happens if we look after the equipment to maximise life (natural deterioration) or if we don’t (forced, or accelerated deterioration). With this understanding, we can develop the most appropriate maintenance strategy to optimise performance (OEE) and how long we can make good product.
Enhancing OEE
There are numerous strategies that can help improve OEE including planned maintenance, operator checks, predictive maintenance, Total Productive Maintenance and Reliability Centred Maintenance to name some of the common ones. Each of those are worthy of their own article, but for our purpose here, the key point is to measure true performance, understand the gaps, and build an equipment strategy to maintain and improve performance.
There have been suggestions in the past that 85% OEE would be ‘world-class’, but this is not true. It depends on the type of process. For example, a chemical processing plant should be at least 95%, whereas a press shop making low volume, high variety may never reach 85% and still be better than the competition.
How does this link to profitability?
There are some clear factors that help. Breakdowns are usually more costly than planned maintenance because more damage can arise in a breakdown – this is a direct cost saving. Secondly, if our assets ‘live’ longer making good product, the return on capital employed improves. These two factors have a positive impact on profit.
measure true performance, understand the gaps, and build an equipment strategy

Measure OEE
To provide a more comprehensive understanding of asset performance than just looking at utilisation.

Tailor OEE Targets to Process Type
The “world-class” OEE target of 85% may not be appropriate for all processes.

Balance Inventory and Asset Utilisation
Overproducing to “sweat assets” can create wasteful inventory, undermine customer value, and reduce profitability.

Optimise Asset Condition
Maintaining assets in optimal condition is key to maximising performance.

Prioritize Proactive Maintenance
To reduce costly breakdowns and extend asset lifespans.

Monitor Asset Deterioration
Understanding the natural and forced deterioration of assets over time is crucial
Find out more on optimising asset performance
If you would like to find out more about the topics introduced here, please get in touch with the team. For a list of services available from Sharing in Growth, please click here, and you can follow the company on LinkedIn by clicking here.